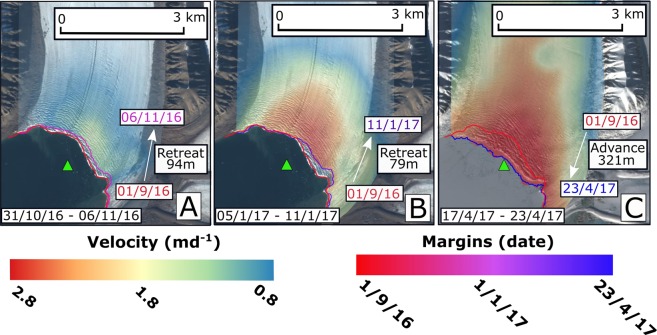
Figure 4.
Velocity fields for Tunabreen calculated for the period shown in the bottom left corner of each panel are displayed. Margin positions from 1 September 2016 and the end of the velocity field calculation period are also shown, along with the mean value across the glacier front of retreat/advance between these two dates. The position of the LoTUS buoy is portrayed by a green triangle. The background images for these panels are from 9 September 2016 (A,B) and 6 April 2017 (C). The background images are Copernicus Sentinel data (2016, 2017) downloaded from the Copernicus Open Access Hub (https://scihub.copernicus.eu/). Terms of use available at https://scihub.copernicus.eu/twiki/do/view/SciHubWebPortal/TermsConditions.

