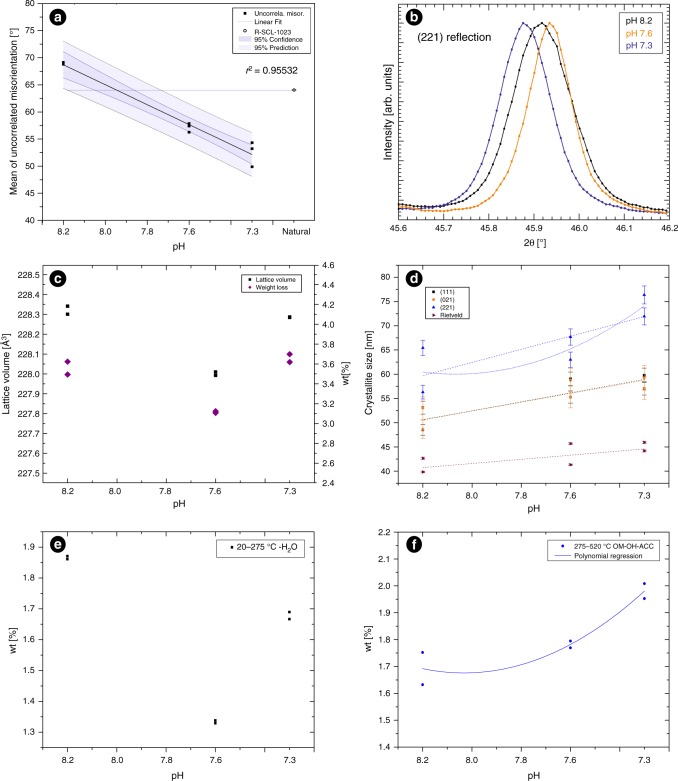
Fig. 2.
Crystallographic changes in the skeleton of Stylophora pistillata cultured at different pH conditions. a Mean of uncorrelated misorientation versus pH and an external natural sample (R-SCL-1023) as a control point. The black line is the linear regression of samples cultured at different pH conditions. The decreasing response to acidification in the mean of uncorrelated misorientation indicates that the crystallographic control exerted by coral at microscale increases at low pH. b Comparison between angular positions of a selected diffraction peak taken, belonging to (221) reflection. Note the shift in the angular position between pH 8.2 on regard to 7.6 samples to higher angles and 7.3 to lower angles. c Lattice volume calculated for each pH (black squares) and the total weight % loss (purple diamonds) in the range 20–520 °C. d Calculations of crystallite size for the skeletons of the 3 different pH treatments. Note the increment of all of them, independently of the method. The error bars represent calculated error of crystal size after refinement of UVW-parameters. Plane (221) is showing a larger crystallite size. Curved blue line corresponds with polynomial regression, whereas straight lines correspond with linear regression. e Water regime (20–275 °C). f OM-OH-ACC regime (275–520 °C). Blue line correspond with the polynomial regression of the points (r2 = 0.843). OM organic matrix, OH OH groups, ACC possible Amorphous Calcium Carbonate

