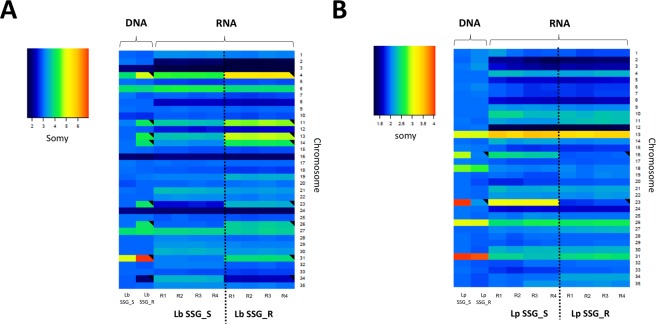
Figure 5.
Relationship between chromosomal copy number variations and gene expression levels in the SSG_S and SSG_R lines of L. braziliensis and L. panamensis. The heatmaps show median normalized read depths of 35 chromosomes (y axis) found in L. braziiensis (Left) and L. panamensis (right) sensitive and resistant to SbIII (x axis) The color key indicates the somy value (S), which ranged from 1 to 5 as follows: monosomy, S < 1.5; disomy, 1.5 ≤ S < 2.5; trisomy, 2.5 ≤ S < 3.5; tetrasomy, 3.5 ≤ S < 4.5; and pentasomy, 4.5 ≤ S < 540. A black triangle in an upper right corner indicates a significant change in S value. R (replicates).

