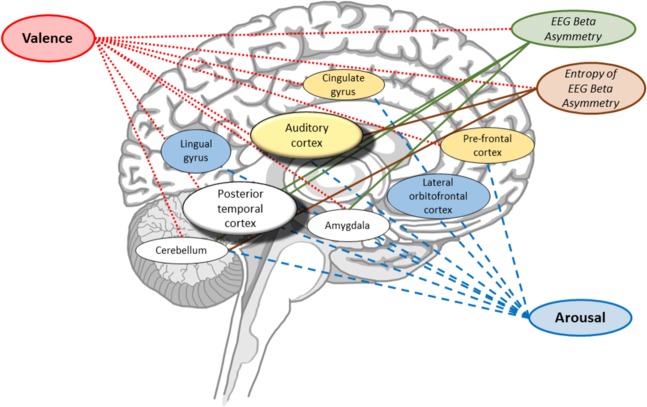
Figure 10.
Schematic of brain regions found to exhibit significant changes in BOLD activity in relation to music-induced changes in valence, arousal, and/or changes in prefrontal asymmetry and the entropy of that asymmetry recorded via the EEG. Colours indicate observed significant associations between measured effects (valence, arousal, beta asymmetry) and changes in BOLD signal. Specifically, blue indicates that a region’s BOLD activity relates to reported arousal only, yellow indicates that a region’s BOLD activity relates to both valence and arousal, and white indicates that a region’s BOLD activity relates to valence, arousal, and measured EEG beta band asymmetry. The line colours and textures (solid or dashed) indicate significant relationships between brain regions and measured processes. Specifically, red dotted lines indicate which brain regions exhibit significant changes with reported valence, green solid lines indicate regions that significantly change with EEG asymmetry in the beta band, red solid lines indicate regions that significantly change with the entropy of the EEG asymmetry, and blue dotted lines indicate regions that significantly change with reported arousal. Note that the brain regions are positioned approximately at their relative locations in the brain, but positioning is not intended to be anatomically precise.

