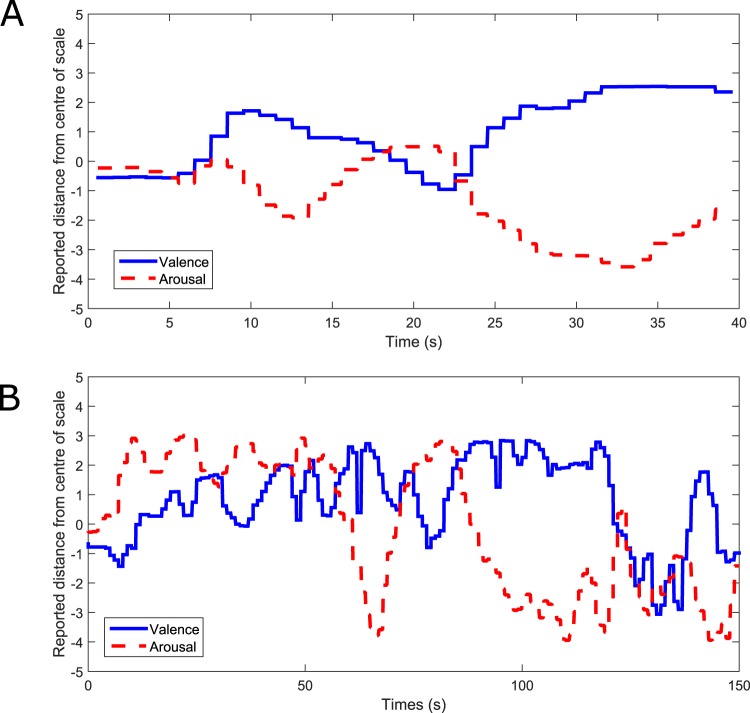
Figure 2.
(A) An example of a participant’s FEELTRACE report during one 40 s music listening and reporting trial, while the participant listened to generated music. (B) An example of a participant’s FEELTRACE report while listening to a piece of classical music (Étude Opus 10, Number 3 in E major by Frédéric Chopin). The y-axis indicates the distance from the ‘neutral’ position of the participant’s reports of their felt valence and arousal (e.g. positive values indicate positive valence/arousal).

