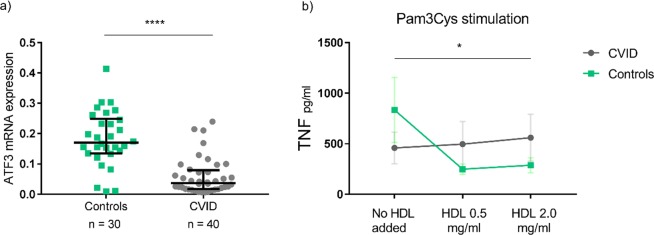
Figure 7.
ATF3 mRNA levels and HDL cholesterol effects on TLR2-stimulated TNF release from mononuclear cells in CVID patients and controls. (a) ATF3 mRNA expression in CVID patients and healthy controls; results given with bars for median and interquartile range, ****p < 0.0001 using Mann-Whitney test between groups. mRNA levels were quantified by qPCR and values given in relation to the reference genes β-actin and GAPDH. (b) Effect of increasing HDL cholesterol concentration on TLR2- (Pam3Cys) stimulated TNF release from mononuclear cells in CVID (n = 6) and controls (n = 6); *p < 0.05. Results illustrated as median with variance, p-values calculated using repeated measures ANOVA analysis. The difference between CVID patients and the control group in TNF release at baseline from mononuclear cells after Pam3Cys stimulation was found non-significant (p = 0.389) when performing Student’s t-test on log-transformed datasets.

