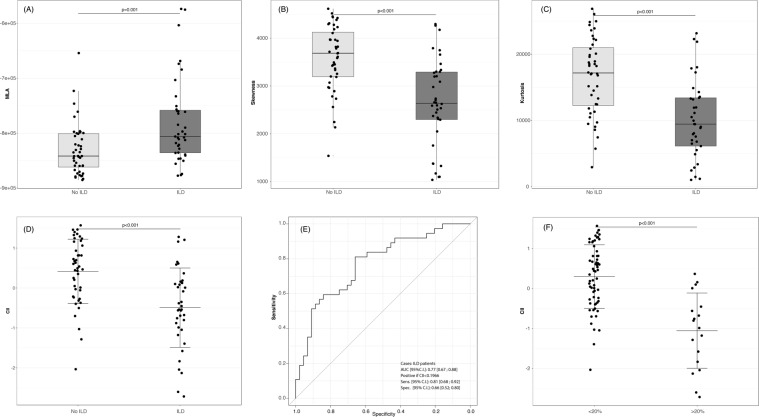
Figure 1.
(A–D) Distribution of densitometric parameter values derived from the analysis of low-dose thin section volumetric lung CT in SSc patients without ILD in comparison with SSc-ILD cases. MLA, skewness and kurtosis are shown in panel (A–C), respectively. Distribution of CII values is shown in panel (D). The lower the value is for MLA and CII, the more severe the lung involvement is; on the contrary the higher the value is for skewness and kurtosis, the more severe the lung involvement is. (E) Diagnostic accuracy of CII by means of receiver-operating characteristic curve analysis. (F) CII in patients with limited (<20%) ILD in comparison with extended ILD (>20%), as assessed by the Goh visual score10. Lines represent mean ± standard deviation. CT = computed tomography; SSc = systemic sclerosis; ILD = interstitial lung disease; MLA = mean lung attenuation; CII = computerized integrated index; AUC = area under the curve; CI = confidence interval.

