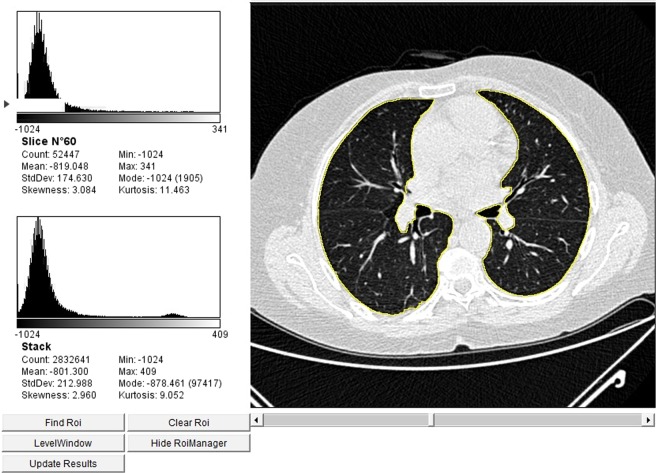
Figure 3.
Comparison between quantitative and visual analysis of low-dose thin section volumetric lung CT in a SSc patient without visual evidence of ILD but a CII lower than the cut-off value of 0.1966 (e. g. CII = −0.3718). On the left, the figure shows the results from digital processing analysis: in the upper-left side of the image, data from the analysis of a single representative slice are given; in the lower-left side of the image the automatically generated averaged data from the analysis of all slices are given. Global pulmonary sampling has been performed and the sampled region is marked in yellow. CT = computed tomography; SSc = systemic sclerosis; ILD = interstitial lung disease; CII = computerized integrated index.

