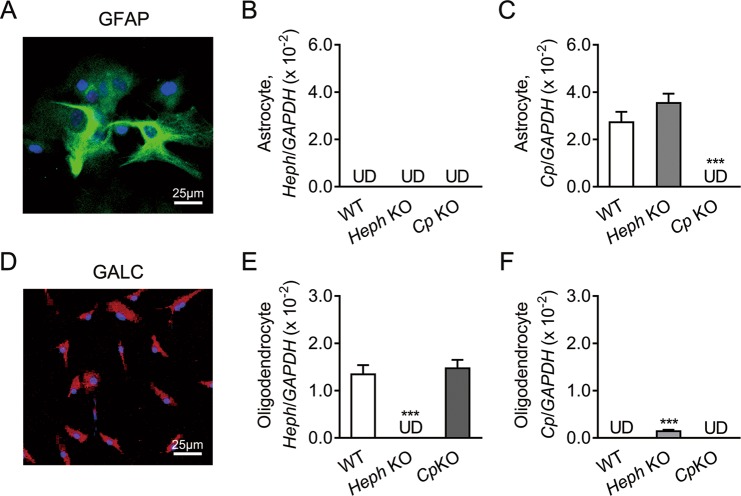
Figure 1.
Heph and Cp gene expression in astrocytes and oligodendrocytes. (A) Representative images of WT astrocytes stained with the astrocyte marker GFAP (green) and DAPI (blue) to show the nuclei. (B,C) Heph (B) and Cp (C) mRNA levels in WT, Heph KO, and Cp KO astrocytes. (D) Representative images of WT oligodendrocytes stained with the oligodendrocyte marker GalC (red) and DAPI (blue) to show the nuclei. (E,F) Heph (E) and Cp (F) mRNA levels in WT, Heph KO, and Cp KO oligodendrocytes. Data are representative of at least three independent experiments. UD: undetectable; values are presented as the means ± SEMs; ***P < 0.001, different from WT, as determined by unpaired Student’s t-test.

