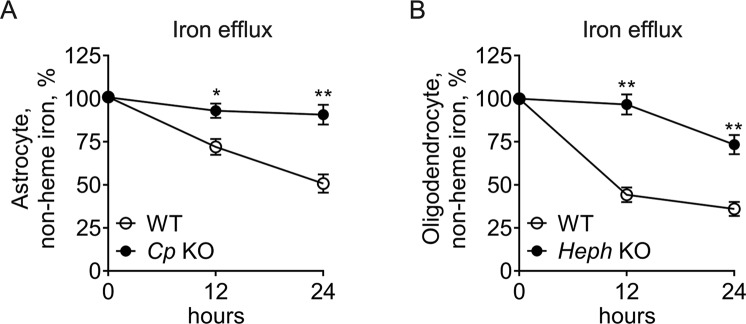
Figure 2.
Iron efflux from Cp KO astrocytes and Heph KO oligodendrocytes. Non-heme iron concentrations in WT and Cp KO astrocytes (A), and WT and Heph KO oligodendrocytes (B) at 0, 12, 24 hours after the cells had been treated with iron then transferred to fresh medium without added iron. Iron within the cells at the 0 hour time point was set to 100%. Data are representative of at least three independent experiments. Values are presented as the means ± SEMs; *P < 0.05, **P < 0.01, different from WT, as determined by unpaired Student’s t-test.

