Figure 6.
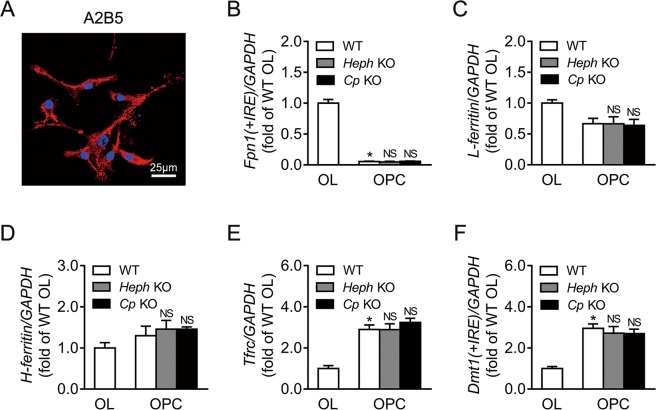
Expression of iron-related genes in WT, Heph KO, and Cp KO OPCs. (A) Representative image of WT OPCs stained with the OPC marker A2B5 (red) and DAPI (blue) to show the nuclei. (B–F) Fpn1(+IRE) (B), L-ferritin (C), H-ferritin (D), Tfrc (E) and Dmt1(+IRE) (F) mRNA levels in WT, Heph KO, and Cp KO OPCs. Expression in WT OLs is also shown. Data are representative of at least three independent experiments. OPC: oligodendrocyte precursor cell, OL: oligodendrocyte; UD: undetectable; NS: not significant vs WT OPCs; values are presented as the means ± SEMs; *P < 0.05, different from WT OLs, as determined by unpaired Student’s t-test.

