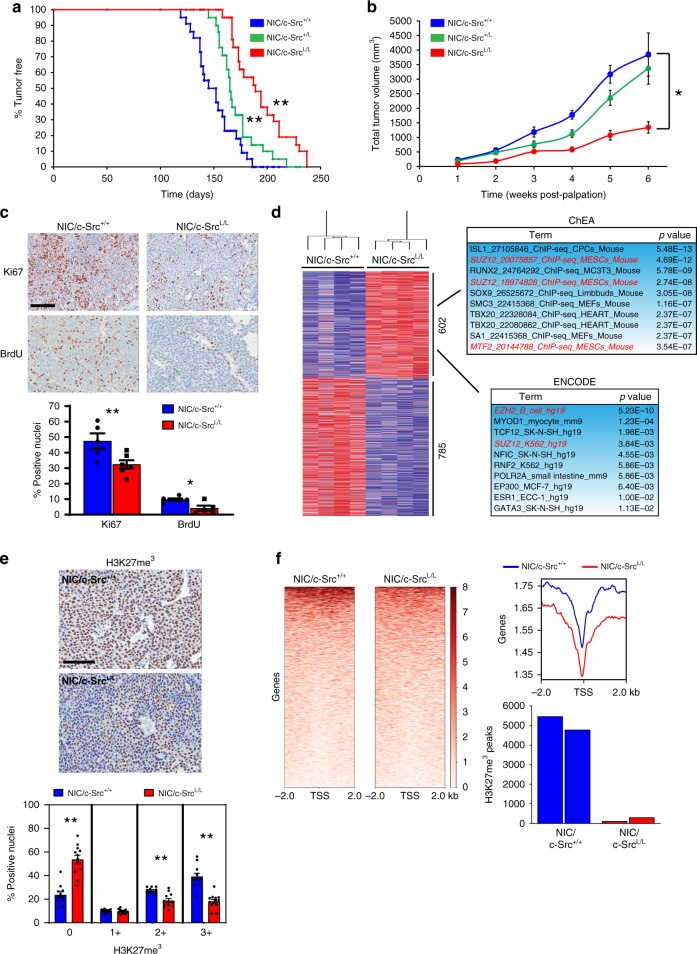
Fig. 1.
c-Src loss impairs tumor growth and PRC2 function in ErbB2 + breast cancer. a Kaplan–Meier analysis of mammary tumor onset in NIC mice with wild-type Src alleles (NIC/c-Src+/+, n = 26) and mice heterozygous (NIC/c-Src+/L, n = 20) or homozygous (NIC/c-SrcL/L, n = 22) for the conditional Src allele. **p < 0.01; logrank test. b Tumor burden was determined by weekly caliper measurements. *p < 0.05; one-way ANOVA with Tukey’s post-test. c Control and c-Src-deficient tumors were stained for Ki67 expression and incorporation of BrdU by immunohistochemistry (IHC). Top panels show representative images. Scale bar represents 100 µm. Bottom panel shows quantification of the percentage of Ki67 and BrdU-positive nuclei in tumors from five independent mice of each genotype (minimum 10,000 total nuclei, *p < 0.05, **p < 0.01; unpaired, two-tailed Student’s t-test). d Left panel - unsupervised hierarchical clustering analysis of genes differentially up-regulated (red) and down-regulated (blue) in NIC/c-SrcL/L tumors compared to NIC/c-Src+/+ controls (n = 4 per genotype). Right panels - bioinformatic identification of PRC2 targets among genes up-regulated in c-Src-deficient tumors. e Upper two panels show representative images of H3K27me3 staining of tumors from three independent NIC/c-Src+/+ and NIC/c-SrcL/L mice using IHC. Scale bar represents 50 μm. Bottom panel shows quantitative nuclear staining intensity scored on a scale of 0–3 using Aperio image analysis software (minimum 10000 nuclei counted per tumor, *p < 0.05, **p < 0.01; unpaired, two-tailed Student’s t-test). f Left panels show genome-wide profiling of the H3K27me3 landscape in NIC/c-Src+/+ and NIC/c-SrcL/L tumor cells using ChIP-Seq, with red color intensity representing tag density. Representative tag density plots (right top panel) and bar chart of the quantification of H3K27me3 peaks in two independent cell lines of each genotype (right bottom panel) are shown. All error bars throughout the figure are SEM

