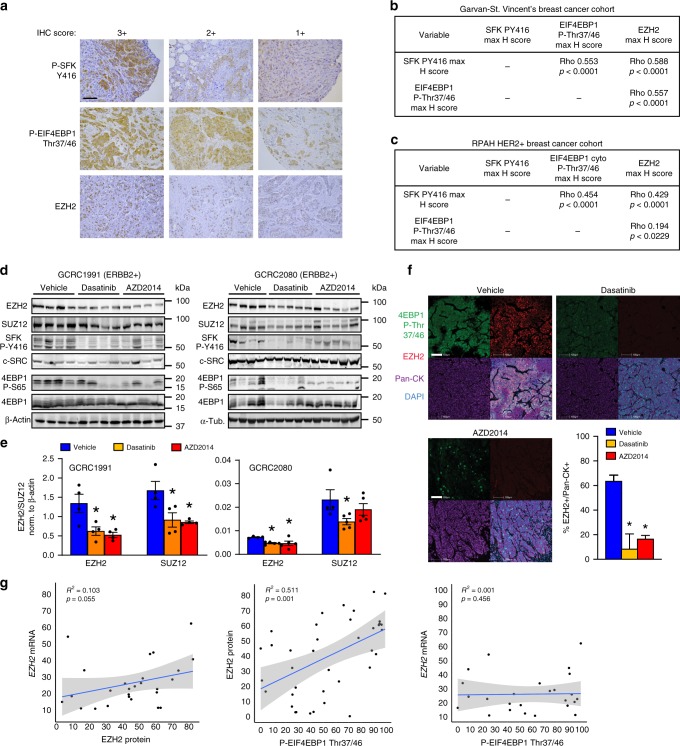
Fig. 4.
c-Src and mTORC1 drive EZH2 protein expression in human breast cancer. a Tissue microarrays (TMAs) containing tumor samples from breast cancer patients were stained with antibodies against EZH2, phosphorylated Src family kinases (SFK) and phosphorylated EIF4EBP1. Example images indicate scoring by a specialist breast cancer pathologist (S.A.O.) with decreased scoring from left to right. Scale bar indicates 100 µm. b, c Associations between staining intensities for each marker in a on two breast cancer TMAs. The Garvan-St. Vincent’s cohort b contained 292 samples from patients of all subtypes, while the Royal Prince Albert Hospital (RPAH) cohort c contained samples from 131 HER2 + breast cancer patients. Rho and p values were calculated using Spearman’s rank-order correlation analysis. d, e ERBB2 + breast cancer patient-derived xenografts GCRC1991 and GCRC2080 were orthotopically implanted into NOD/SCID/gamma (NSG) mice which were treated with the SFK inhibitor Dasatinib (n = 7), the ATP-competitive mTOR kinase inhibitor AZD2014 (n = 7) or vehicle (n = 6). EZH2 and SUZ12 levels and the activity of SFK and mTORC1 were determined by immunoblotting of tumor tissue lysates d. Bar charts e show quantification of EZH2 and SUZ12 levels normalized to the loading control (ACTB) using fluorescent immunoblotting (n = 4, *p < 0.05, unpaired Student’s t-test vs vehicle). f Immunofluorescence analysis of EZH2 expression and phosphorylation of EIF4EBP1 in ERBB2 + PDX tumors following administration of inhibitors or vehicle control. Bottom right panel - digital pathology analysis software (HALO) was used to quantify EZH2 staining in tumor cells (positive for human-specific pan-cytokeratin staining). Scale bars indicate 100 µm (minimum 10000 cells counted per tumor, *p < 0.05, unpaired, two-tailed Student’s t-test). g EZH2 protein expression and EIF4EBP1 phosphorylation were quantified in samples from ERBB2 + breast cancer patients using immunofluorescence with digital pathology analysis as in f. Pearson’s correlation analysis was used to correlate these parameters with each other and with EZH2 mRNA levels (RNA-Seq reads) determined in the same samples. Left panel shows the correlation between EZH2 mRNA and protein, middle panel shows the correlation between EZH2 protein and phospho-EIF4EBP1, right panel shows the correlation between EZH2 mRNA and phospho-EIF4EBP1. All error bars in this figure are SEM

