Fig. 5.
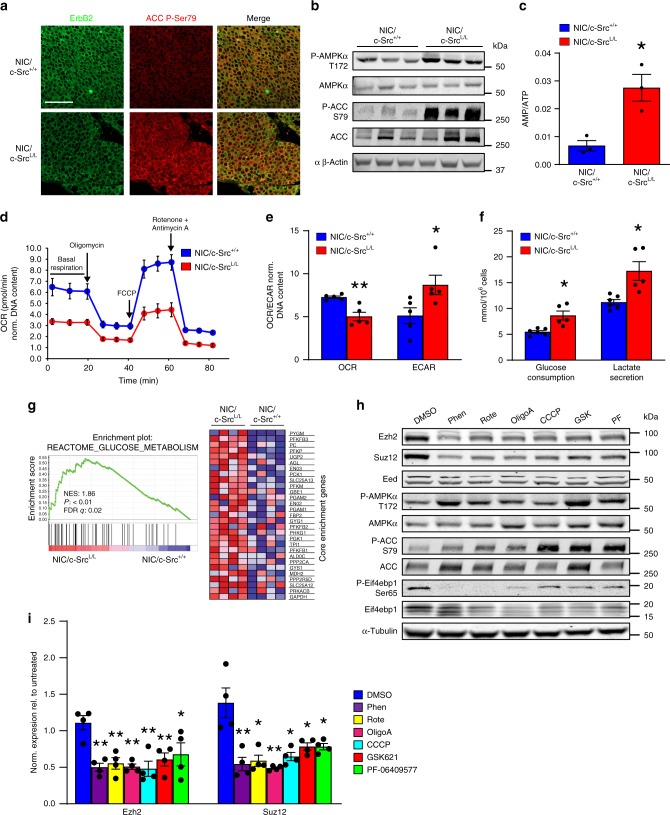
Impaired OXPHOS and induction of energy stress reduce PRC2 expression. a IF analysis of ErbB2 expression and ACC phosphorylation in c-Src-proficient and -deficient ErbB2 + mammary tumors. Representative images from five tumors of each genotype. Scale bar represents 50 µm. b Representative immunoblot showing AMPK activation and ACC phosphorylation in NIC/c-Src+/+ and NIC/c-SrcL/L cell lines. c LC/MS analysis of AMP:ATP ratios in NIC/c-Src+/+ and NIC/c-SrcL/L cell lines (3 cell lines per genotype). d Basal, maximal (FCCP), ATP-synthesis-coupled (Oligomycin A), and non-mitochondrial (rotenone/antimycin A) oxygen consumption rates (OCRs) of NIC/c-Src+/+ and NIC/c-SrcL/L cells. Representative of 5 cell lines per genotype. e Quantification of basal OCR and extracellular acidification rates (ECAR) of NIC/c-Src+/+ and NIC/c-SrcL/L cell lines. (5 cell lines per genotype). f Glucose consumption and lactate levels in conditioned media from NIC/c-Src+/+ and NIC/c-SrcL/L cell lines (5 cell lines per genotype). g Representative plot and heatmap from GSEA showing increased expression of genes associated with glucose metabolism in NIC/c-SrcL/L tumors relative to NIC/c-Src+/+ controls (4 tumors per genotype). h NIC cells were treated for 24 h with the mitochondria-targeting agents phenformin (Phen, 100 µM), rotenone (Rote, 0.5 µM), Oligomycin A (OligoA, 1 µM) or CCCP (1 µM) or the allosteric AMPK activators GSK621 (GSK, 25 µM) or PF-06409577 (PF, 50 µM) for 24 h. Representative immunoblots of PRC2 component expression, AMPK and mTORC1 pathway activation are shown. i Quantification of Ezh2 and Suz12 protein expression in four independent cell lines treated as in h. All bar charts show mean±SEM, with * = p < 0.05 and ** = p < 0.01 (unpaired, two-tailed Student’s t-test)

