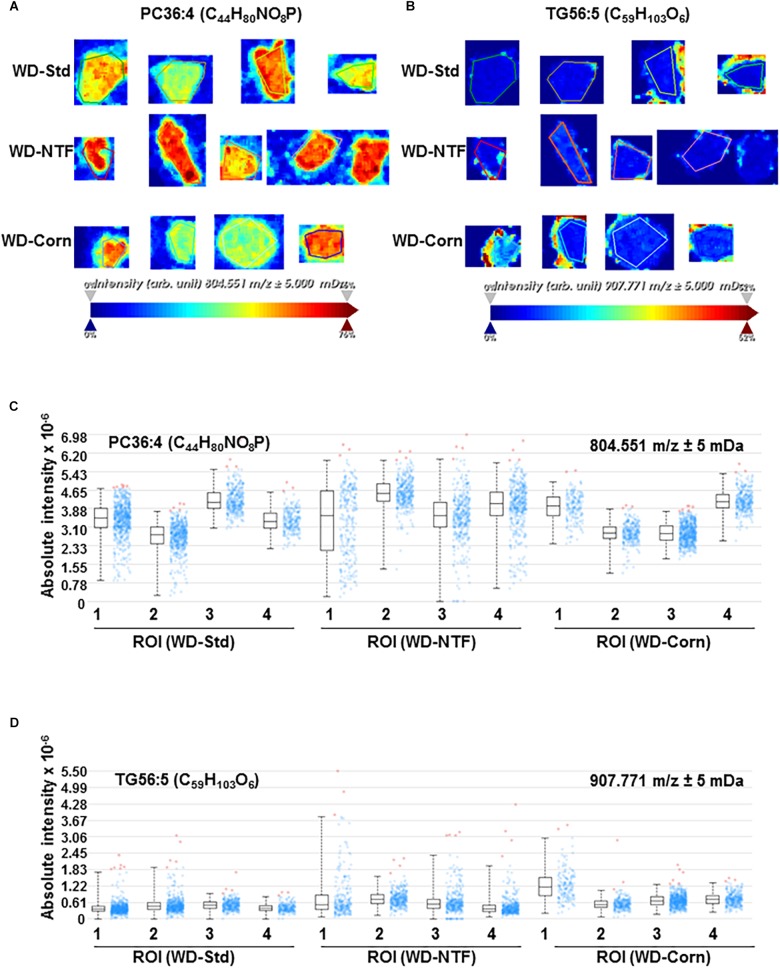
FIGURE 3.
Comparison of individual lipid concentration and distribution by high resolution mass spectrometry imaging. Lipid composition in the liver of animals receiving the WD-Std, WD-NTF or WD-Corn compositions were assessed by mass spectrometry imaging (n = 4). Exemplary images of panel (A) phosphatidylcholine 36:4 (PC(36:4)) and (B) TG 56:5 (TG(56:5)) and corresponding quantified signal intensities of panel (C) PC(36:4) and (D) TG(56:5) are shown. Among all observed lipid species, no significantly different accumulation was found.

