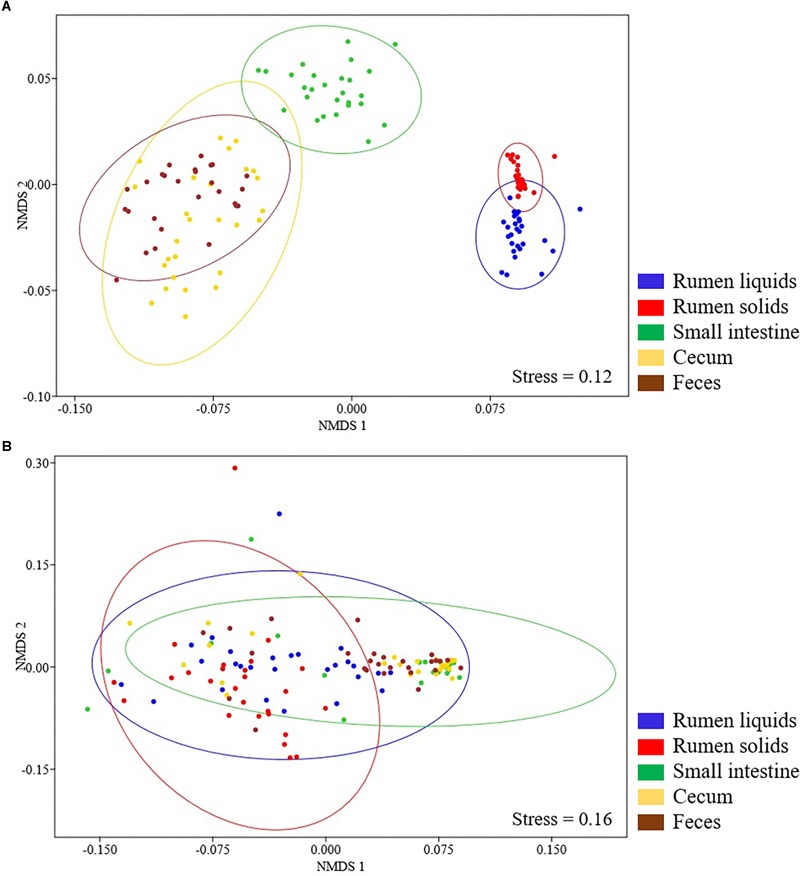
FIGURE 2.

Non-metric multidimensional scaling (nMDS) plots of the Bray-Curtis dissimilarity index for bacterial (A) and fungal (B) communities in the GIT of Nelore steers. Individual points represent GIT samples from different steers and different colors represent distinct GIT segments. Ellipses represent 95% confidence intervals.
