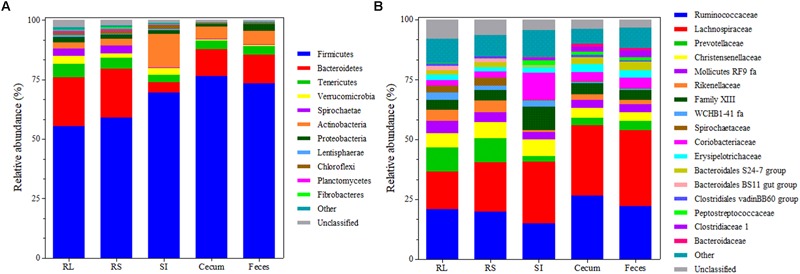
FIGURE 3.

Bacterial composition at the phylum (A) and family (B) level across the GIT of Nelore steers. Each bar represents the mean bacterial community composition in rumen liquids (RL), rumen solids (RS), small intestine (SI), and cecum and feces. For phylum, “other” corresponds to the sum of phyla that showed relative abundance <0.5%. For family, “other” corresponds to the sum of families that showed relative abundance <1%.
