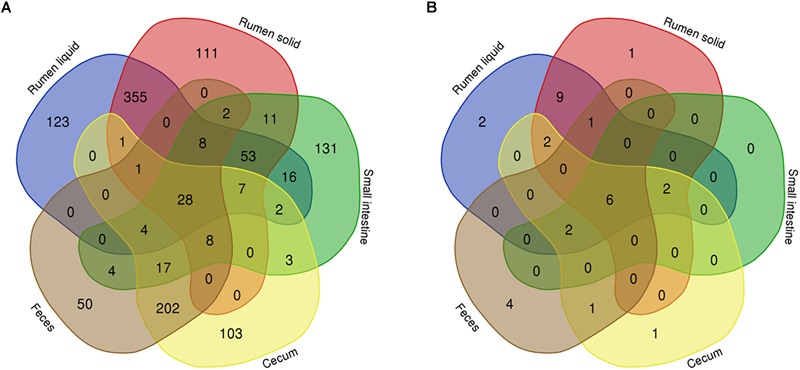
FIGURE 4.

Venn diagrams showing the number of bacterial (A) and fungal (B) OTUs shared between rumen (liquid and solids), small intestine, and cecum and feces. Only bacterial OTUs that were present in at least 50% of all steers (13 animals) from each GIT segment are represented.
