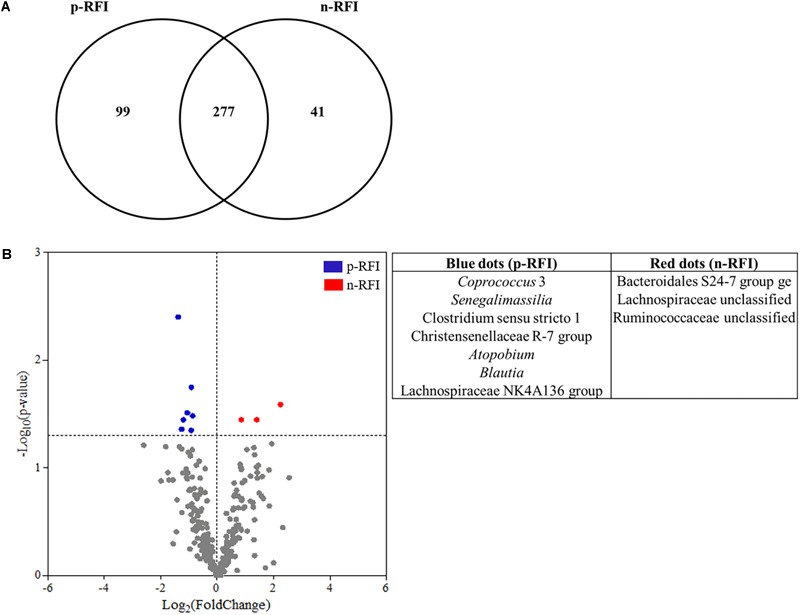
FIGURE 6.

Differences in the fecal bacterial community from p-RFI and n-RFI Nelore steers. (A) Venn diagram showing the number of bacterial OTUs shared in the fecal samples of p-RFI and n-RFI Nelore steers. Only bacterial OTUs that were present in at least 50% of the steers from each feed efficiency group (at least 7 animals to p-RFI and 6 animals to n-RFI) are represented. (B) Differences in the relative abundance of shared OTUs from feces of Nelore steers. Each point represents an OTU and points that showed Log2(FoldChange) > 0 were OTUs showing higher abundance in n-RFI steers, while points that showed Log2(FoldChange) < 0 were OTUs showing higher abundance in p-RFI steers. Red points are OTUs statistically more abundant in n-RFI steers and blue points represent OTUs that were statistically more abundant in p-RFI steers (White’s non-parametric t-test, P < 0.05).
