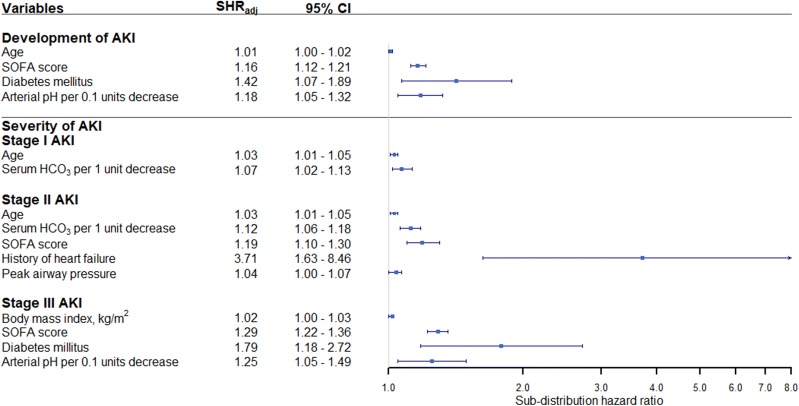
Fig. 2.
Forest plot showing the results of multivariable competing risk regression analysis for factors associated with development of acute kidney injury and severity of acute kidney injury. The x-axis represents the adjusted subdistribution hazard ratio (SHRadj) on a log scale with the reference line (solid vertical line), adjusted subdistribution hazard ratio (square), and 95% confidence interval (whisker)

