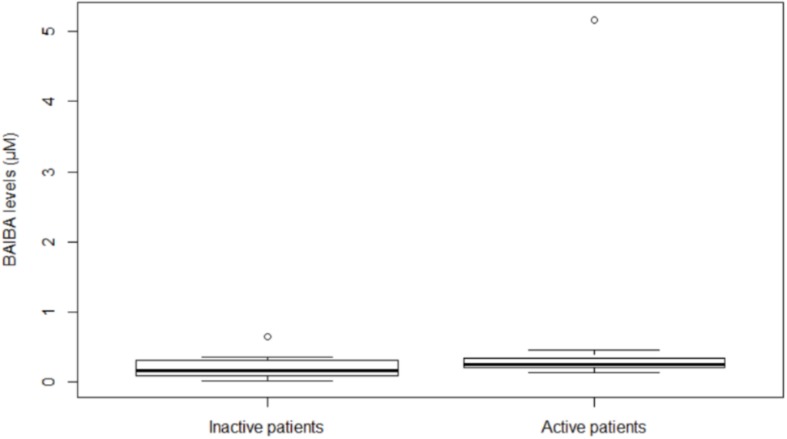
FIGURE 1.
Plasma BAIBA levels in hemodialysis inactive and active patients at month 24. Box plot of BAIBA levels (μM) stratified by inactive or active patients. BAIBA levels were significantly higher in active with respect to inactive patients (P = 0.043). Lines represent the median, 25th and 75th percentiles, and the whiskers (error bars) below and above the box indicate the 10th and 90th percentiles. BAIBA, beta-aminoisobutyric acid.

