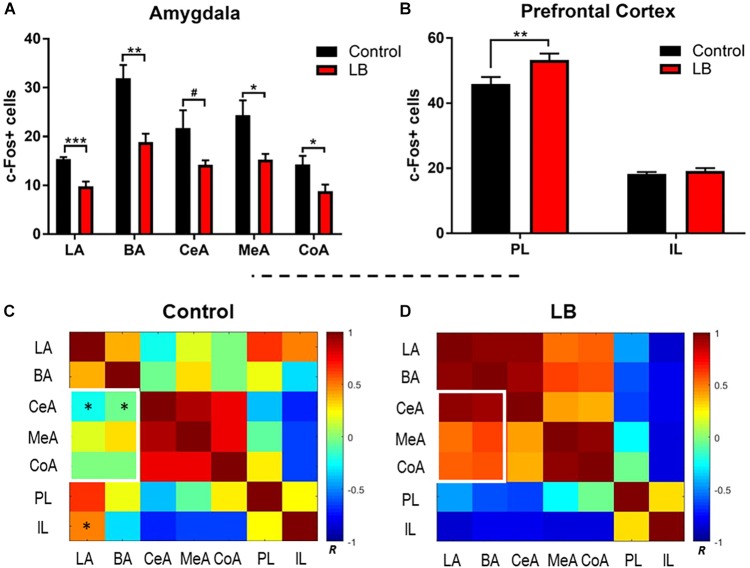
FIGURE 4.
Amygdala and prefrontal cortex activation following memory retrieval at 24 h in adolescent animals. (A) Amygdala subnuclei activation following fear retrieval at 24 h in both control (black) and abused (red) animals; LA: lateral nucleus, B: basal nucleus, CeA: central nucleus, CoA: cortical nucleus, and MeA: medial nucleus. (B) Prefrontal cortex activation following fear memory retrieval at 24 h in both normal (black) and abused (red) animals; PL: prelimbic cortex, IL: infralimibic cortex. (C,D) Bivariate correlation matrices were contructed across regions assessed for c-Fos levels after cue test during adolescents following control or low bedding rearing. White squares denote example nodules (groups of regions) that show dramatic changes in connectivity across condition. Color bar shows Pearson’s r values with positive correlations in red and negative correlations in blue. For statistical comparisons, r values were converted to z scores via Fisher transform and compared using ANOVA. Asterisks indicate pairwise correlations that significantly differed between LB and control. ∗p < 0.05, ∗∗p < 0.01, ∗∗∗p < 0.001, and #p = 0.05.

