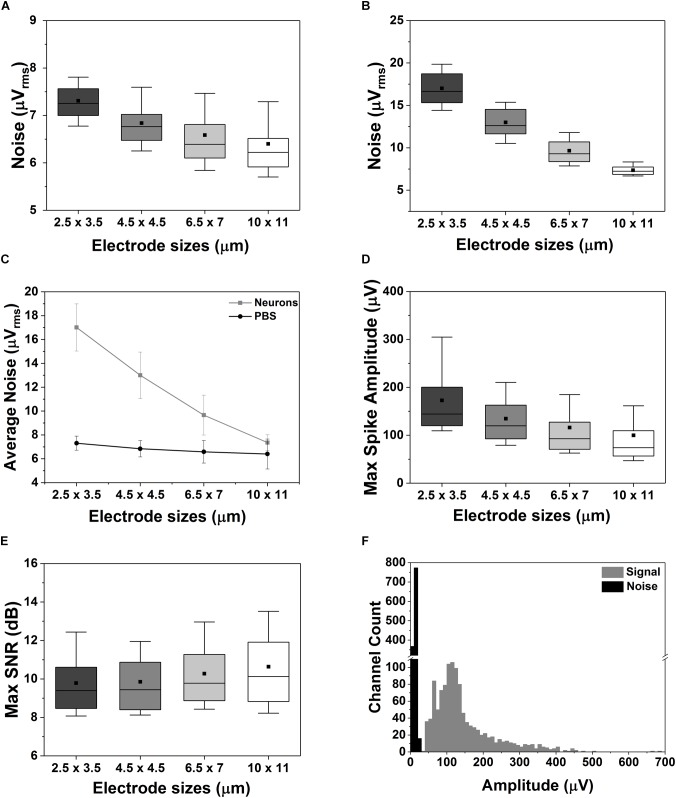
FIGURE 5.
Effect of electrode sizes on noise, maximum spike amplitude and SNR. (A–C) Box plot of the electrode-size dependency of the noise measured in saline solution (A) or in case of a 15 DIV neuronal culture grown on the CMOS MEA chip (B). Electrode size dependency of the average noise behavior between PBS and neuronal cultures (C). (D,E) Box plot of the maximum spike amplitude (D) and of the maximum SNR (E) for different electrode sizes. The data were acquired on a 15 DIV neuronal culture over in n = 5 measurements. (F) Distribution of the amplitude of the signal and of the noise recorded from 1024 electrodes in n = 5 measurements. In all the box plots in this figure the outliers were removed, the horizontal line represents the median, the black square represents the mean, the box boundaries the 25th and 75th percentile while the whiskers represent the 10th and 90th percentile.

