FIGURE 3.

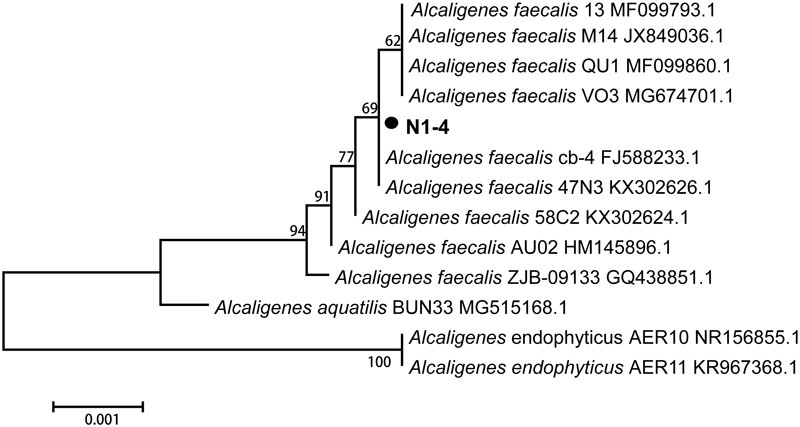
Phylogenetic tree analysis of N1-4 and other homologous strains based on 16S rRNA sequences. The tree was constructed with neighbor-joining methods and the scale bar represents the number of substitutions per base position.

Phylogenetic tree analysis of N1-4 and other homologous strains based on 16S rRNA sequences. The tree was constructed with neighbor-joining methods and the scale bar represents the number of substitutions per base position.