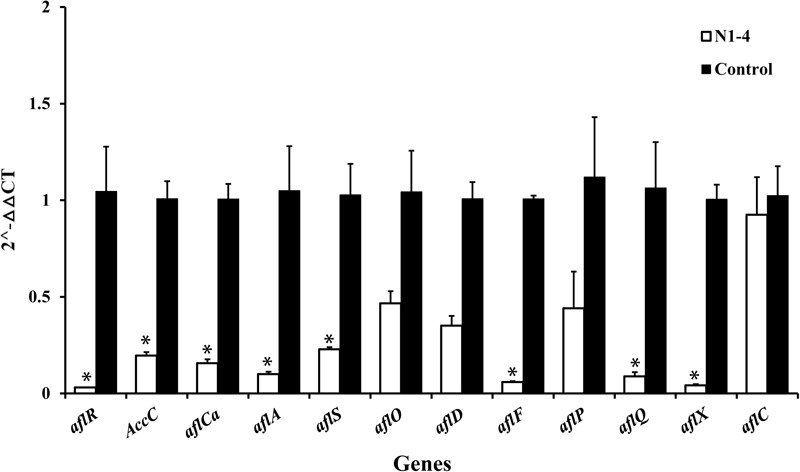
FIGURE 9.

Expression of genes (RT-qPCR) involved in aflatoxin biosynthesis pathway of A. flavus effected by volatiles from N1-4. The fold change of genes in N1-4 treatment was calculated with 2∧-ΔΔct method. And ΔΔct = ΔCt in N1-4 treatment -ΔCt in control treatment. ∗means significant difference at p < 0.05 compared to CK treatment.
