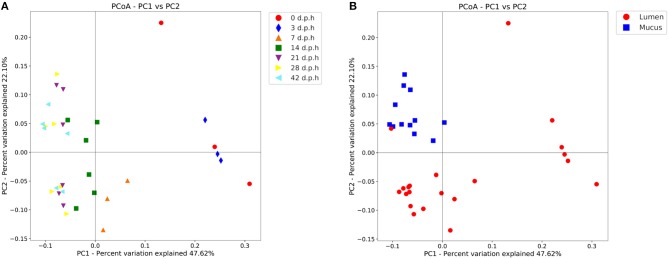
Figure 2.
Principal coordinate analysis (PCoA) plot showing differences in weighted UniFrac beta diversity at different time points (A) and areas sampled (B). Each point represents a pooled sample with distance between points representative of differences in microbiota composition. Between 0 and 14 days post hatch, the changes in beta diversity between time points are notable with large distances between samples taken at 0, 3, 7, and 14 d.p.h. There are no significant changes in beta diversity from 21 days post hatch which is evidenced by the closer clustering of samples from 21, 28, and 42 d.p.h. Mucus and lumen samples form separate clusters suggesting a different microbiota composition.

