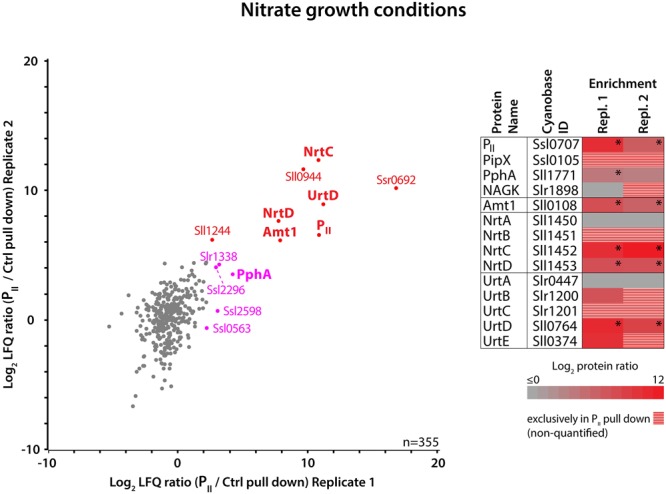
FIGURE 3.

Proteins enriched in anti-FLAG-tag PII immunoprecipitates from nitrate growth conditions. (Left) Scatterplot of the log2 transformed LFQ protein ratios (PII/control pull-down experiment) of 355 quantified proteins detected in two independent replicates. PII pull-down specific outliers which are significantly enriched in both replicates are indicated in red, and significant outliers enriched only in Replicate 1 are indicated in magenta (p-value = 0.01). (Right) Heat map representation of the PII-specific enrichment of nitrogen metabolism related proteins. Log2 transformed LFQ protein ratios from both replicates are color coded and stars indicate significance. Proteins with missing LFQ ratios, detected exclusively in the PII but not in the control pull-down, are striped in red/gray.
