Figure 3.
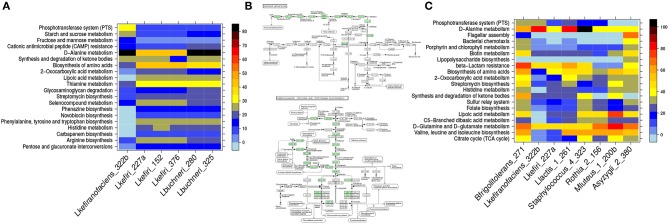
Pathway enrichment reveals differences between organisms within one cluster and between clusters. In (A) the six lactobacilli isolated from the kefir consortium are compared regarding their pathway coverage. We show the KEGG pathways that have the highest standard deviation based on their pathway coverage. The organisms differ significantly in coverage of e.g., histidine, phenylalanine, tryptophan, and tyrosine metabolism. These pathways are absent in L. kefiranofaciens but present in all other lactobacilli (B); green means that a KO is present associated with the respective reaction. As there are no KO's found in the maps for L. kefiranofaciens, the maps are not shown). In (C) the representatives of each cluster (determined by affinity propagation) are compared and the pathways are listed that show the highest standard deviation regarding their pathway coverage. Acetobacter (Asyzygii_2_380) have the highest enrichment for both flagella assembly and chemotaxis (discussed in the main text).

