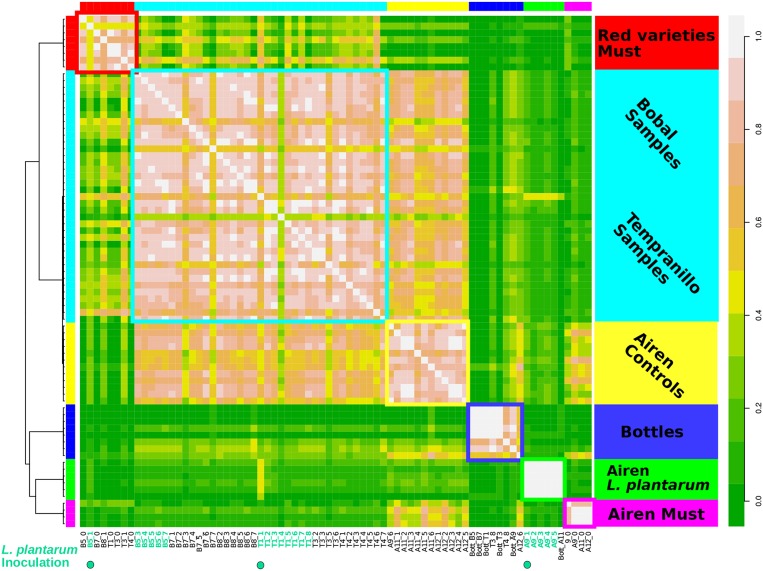
Figure 5.
Metagenomics samples of wine fermentation grouped with high resolution using annotated metagenomes. Samples are clustered based on the KO's abundance yielding six different clusters. Left color bar and squares indicates the samples of individual clusters. Similarly inner right side bar legend describe the big majority of the samples. The outer right side bar indicates coloring of the correlation. The resulting groups reveal three discriminative modes.

