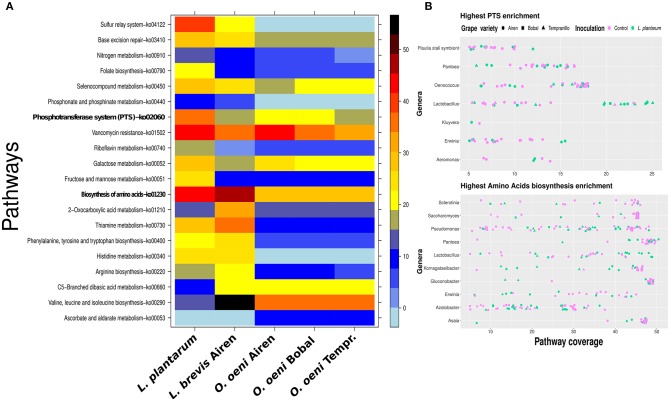
Figure 6.
Pathway enrichment reveals differences between the major malolactic fermentors. In (A), a comparison between L. plantarum, O. oeni bins and L. brevis bin. The right side color bar visualizes the percentage of the coverage of each pathway. In (B), the top ten genera on pathway coverange for PTS (top panel) and amino acids biosynthesis (bottom panel). Only samples with more than 5% coverage are shown, which results in seven genera visualized in the top panel (B).

