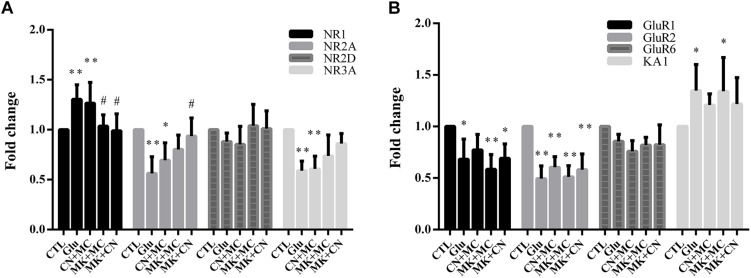
FIGURE 3.
The mRNA level of various subtypes of ionotropic glutamate receptors after antagonist and glutamate treatment. (A,B) Fold change of various subtypes of glutamate receptors mRNA level detected by real-time PCR; MK, CN, and MC were used at a concentration of 10, 10, and 50 μ, 30 min before 15 min glutamate insult. To ensure consistency of the results, experiments were repeated four times. Data were analyzed using one-way ANOVA. *p < 0.05, ∗∗p < 0.01 vs. respective CTL group, #p < 0.05 vs. respective Glu group.

