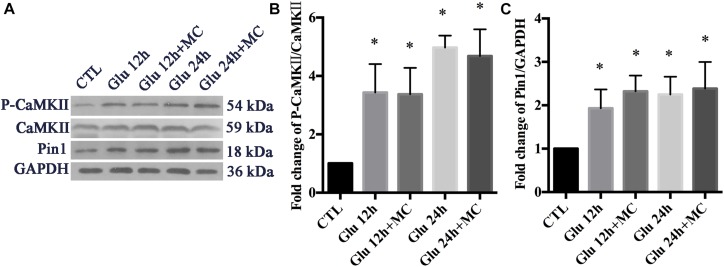
FIGURE 4.
Expression of CaMKII, p-CaMKII and Pin1 in retinal neurons following glutamate treatment. (A) Western blot of CaMKII, p-CaMKII and Pin1 expression. (B) The statistical analysis of p-CaMKII/CaMKII expression. (C) The statistical analysis of Pin1 expression. MC was used at a concentration of 50 μ, 30 min before glutamate insult. N = 3 cultures. Data were analyzed using one-way ANOVA. *p < 0.05 vs. CTL group.

