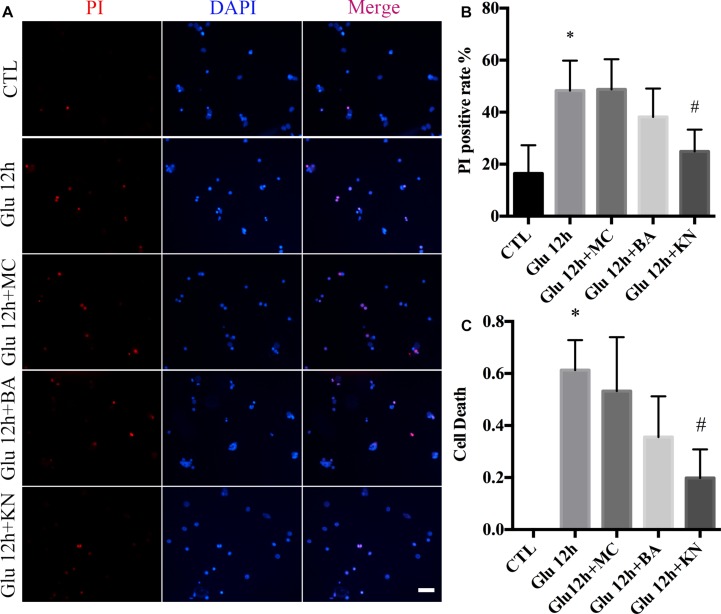
FIGURE 7.
Glutamate-induced necrosis decreased by KN treatment. (A) Retinal necrotic neurons were stained with PI (red). Nuclei were counterstained with DAPI (blue). (B) Statistical analysis of PI-positive retinal neurons. (C) The percentage of necrotic neurons after glutamate treatment and pretreated with 50 μM MC, 10 μM BA, and 10 μM KN was determined by LDH release assay. N = 3 cultures. Data were analyzed using one-way ANOVA. *p < 0.05 vs. CTL group, #p < 0.05 vs. Glu group. Scale bar = 20 μm in all panels.

