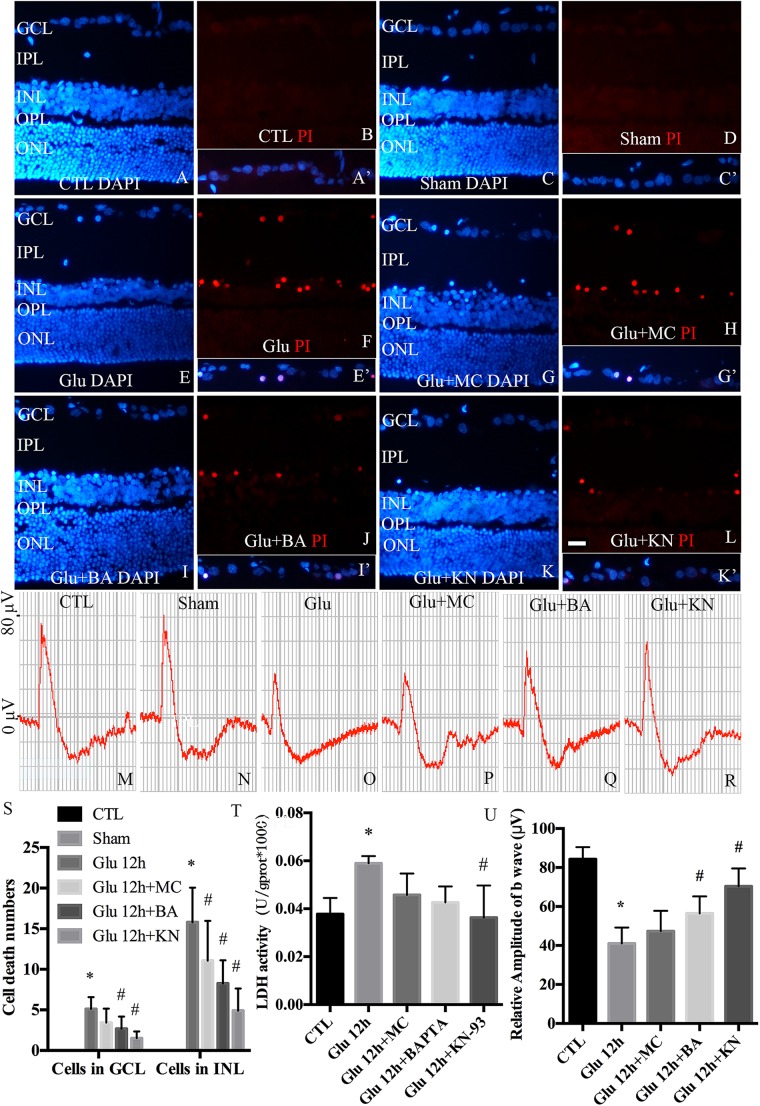
FIGURE 8.
Necrosis and visual function in retina in vivo. (A,C,E,G,I,K) Nuclei were stained with DAPI (blue). (B,D,F,H,J,L) Retinal necrotic neurons were stained with PI (red). Nuclei and PI stained cells in GCL as indicated are shown in the merged frame areas (A′,C′,E′,G′,I′,K′). (M,N,O,P,Q,R) Representative fERG results of groups treated with glutamate and pretreated with different drugs. (S) Statistical analysis of PI stained cells in GCL and INL in retina. (T) The percentage of necrosis cells were determined by LDH release assay. (U) Statistical analysis of the b wave amplitudes. *p < 0.05 vs. CTL group, #p < 0.05 vs. Glu group. Each group was composed of four animals. Data were analyzed using one-way ANOVA. GCL, ganglion cell layer; IPL, inner plexiform layer; INL, inner nuclear layer; OPL, outer plexiform layer; ONL, outer nuclear layer. Scale bar = 20 μm in all panels.

