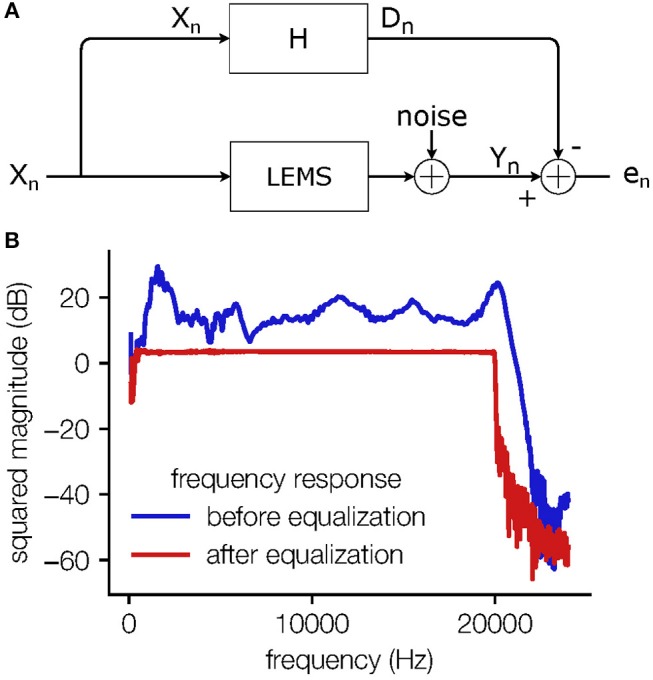
Figure 3.

Equalizer scheme. (A) The block diagram of the system identification task; the output signal Xn of the soundcard is fed into the Loudspeaker-Enclosure-Microphone-System (LEMS) and recorded by the microphone. The measurement noise is modeled here separately as being added in the discrete time domain. The same signal Xn is fed into the adaptive filter H and the difference signal en is used to adjust the filter coefficients. This iterative process leads to a filter that mimics the transfer function of the “unknown system”. (B) The frequency response of the overall system without equalization (blue) and with equalization (red). The frequency response is flattened in the range from 2 to 20 kHz.
