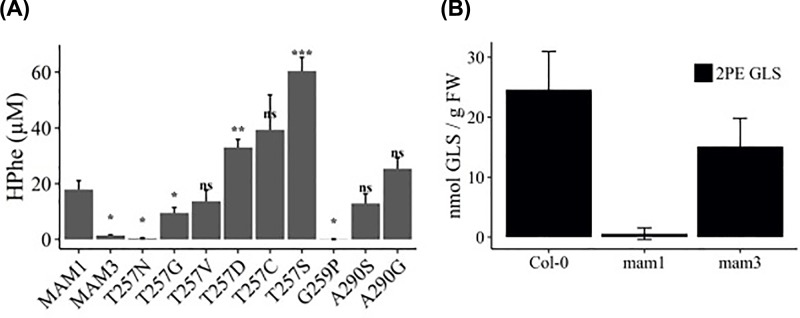
Figure 7. Production of HPhe in E. coli by MAM1 variants and the effect of MAM mutants on HPhe-derived glucosinolates in A. thaliana.
(A) Production of HPhe in MAM variants with changed specificity toward phenylalanine. Data represent average and standard deviation of three biological replicates each grown in three technical replicates. Tukey’s HSD (Honestly Significant Difference) was used for statistical analysis. Variants marked with asterisk denotes significant changes: P-values: 0.01–0.05 = *; P-values: 0.001–0.01 = **; P-values: 0–0.001 = ***. (B) Glucosinolate analysis in A. thaliana ecotype Col-0 and knockout mutants mam1 and mam3. Data represent average and standard deviation of 3–7 biological replicates.

