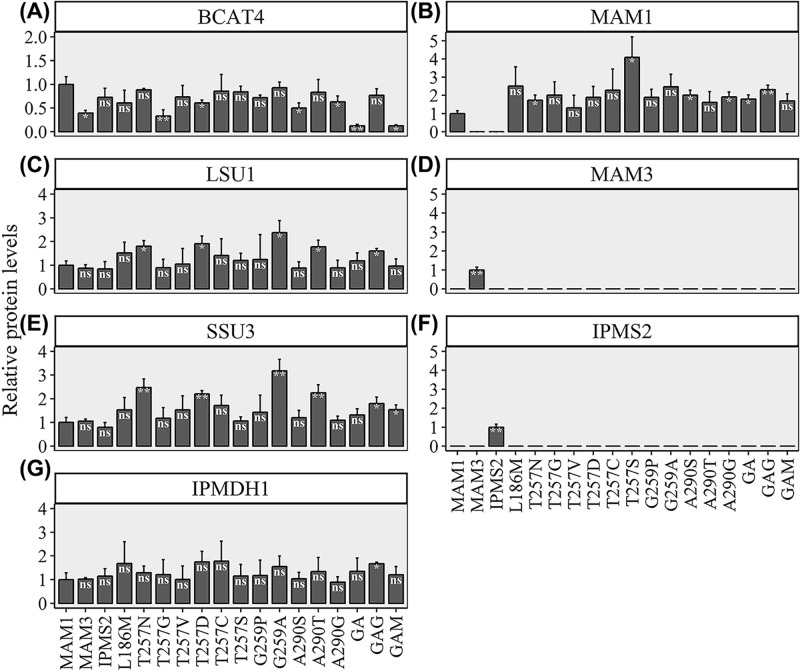
Figure 8. Protein levels in E. coli strains expressing the chain elongation pathway genes.
(A) BCAT4, (B) MAM1, (C) LSU1, (D) MAM3, (E) SSU3, (F) IPMS2 and (G) IPMDH1. A representative peptide for each protein was used for relative quantification. Data represent average and standard deviation of three biological replicates.

