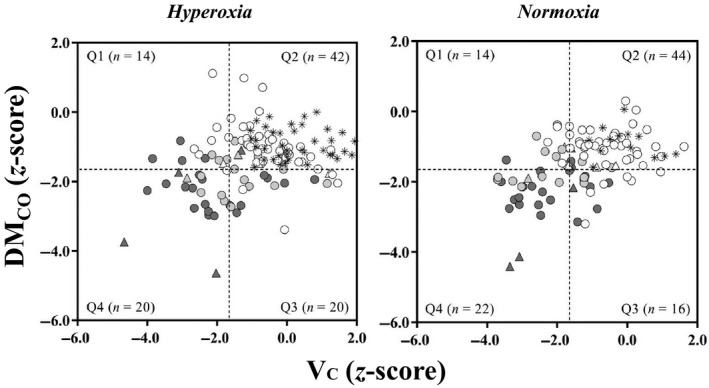
Figure 2.

Relationships between the z‐scores of alveolar membrane diffusive conductance for CO (DMCO) (y‐axis) and pulmonary capillary blood volume (VC) (x‐axis) in mild hyperoxia (left panel) and normoxia (right panel) in healthy controls (asterisks) and SSc subjects. Symbols indicate subjects with spirometry and total lung capacity (TLC) > LLN5 (white), DLCO < LLN5 (light grey), and TLC < LLN5 (dark grey). Triangles indicate subjects with systolic pulmonary artery pressure (sPap) > 36 mmHg. The dashed lines indicate the LLN5 (z‐score < −1.645). The absolute values indicate the number of the total 96 test results for DMCO that fall into each quadrant (Q1–Q4).
