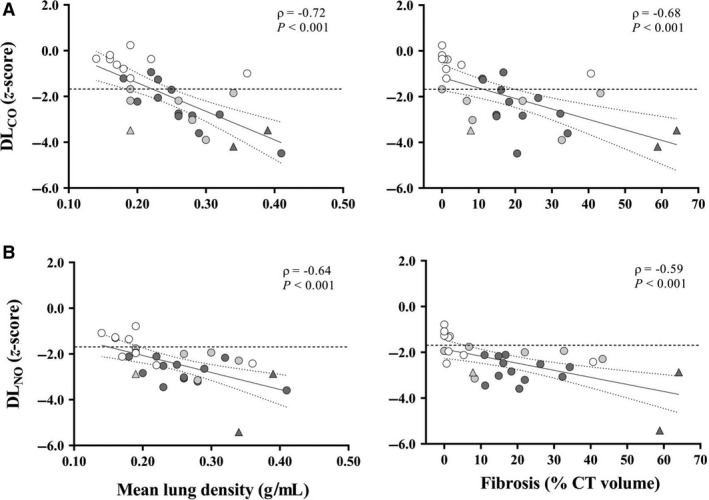
Figure 4.

Correlations between mean lung density (g·mL−1) or fibrosis extent (% CT volume) and z‐scores of (A) standard DLCO and (B) DLNO. Symbols indicate SSc subjects with spirometry and TLC > LLN5 (white), DLCO < LLN5 (light grey), and TLC < LLN5 (dark grey) with (n = 11) or without (n = 3) DLCO < LLN5. Triangles indicate subjects with sPap > 36 mmHg. CI95% of the best‐fit regression line is marked by dotted lines whereas horizontal dashed line indicates the 5th percentile of reference values (−1.645 z‐score).
