Figure 8.
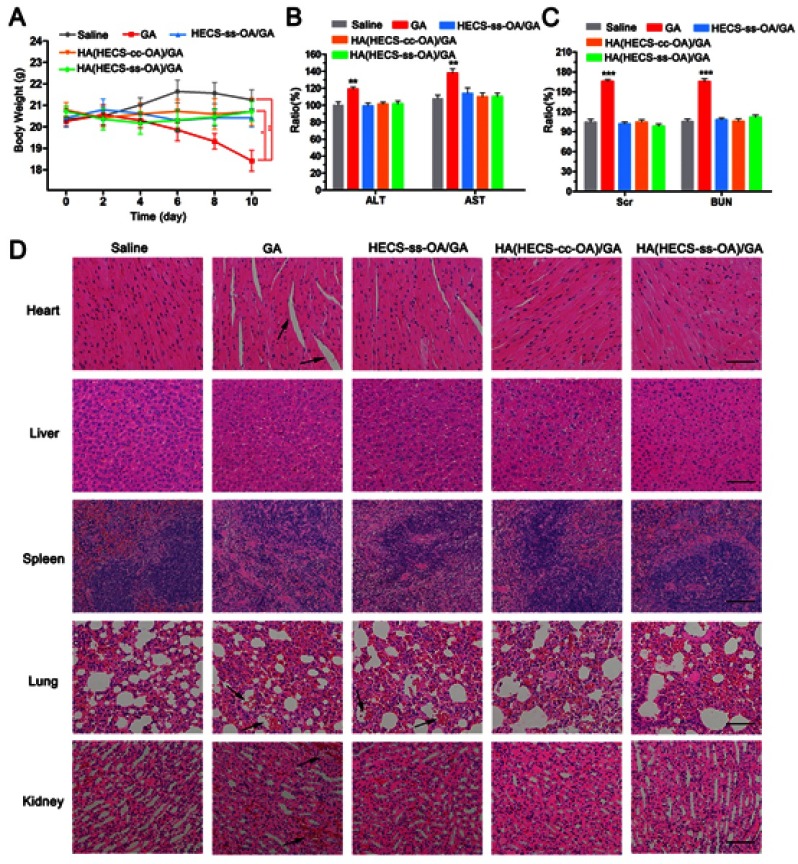
(A) The weight of mice during the treatment period. Data are represented as the mean ± SD (n = 5). **P < 0.01; *P < 0.05. The changes of serum ALT, AST (B), Scr and BUN (C) levels from A549 tumor-bearing mice after administration of different formulations. Data are represented as the mean ± SD (n = 3). (**p < 0.01 vs Saline). (D) Images of H&E-stained heart, liver, spleen, lung and kidney tissues from A549 tumor-bearing mice after intravenous injection of different formulations. Scar bar is 100 μm. The black arrows indicated the severe organ damages.
Abbreviations: HA, hyaluronic acid; HECS, hydroxyethyl chitosan; OA, octylamine; GA, gambogic acid; ALT, alanine transaminase; AST, aspartate transaminase; Scr, serum creatinine; BUN, blood urea nitrogen.

