. 2018 Aug 6;34(7):1089–1098. doi: 10.1093/ndt/gfy255
© The Author(s) 2018. Published by Oxford University Press on behalf of ERA-EDTA. All rights reserved.
This article is published and distributed under the terms of the Oxford University Press, Standard Journals Publication Model (https://academic.oup.com/journals/pages/open_access/funder_policies/chorus/standard_publication_model)
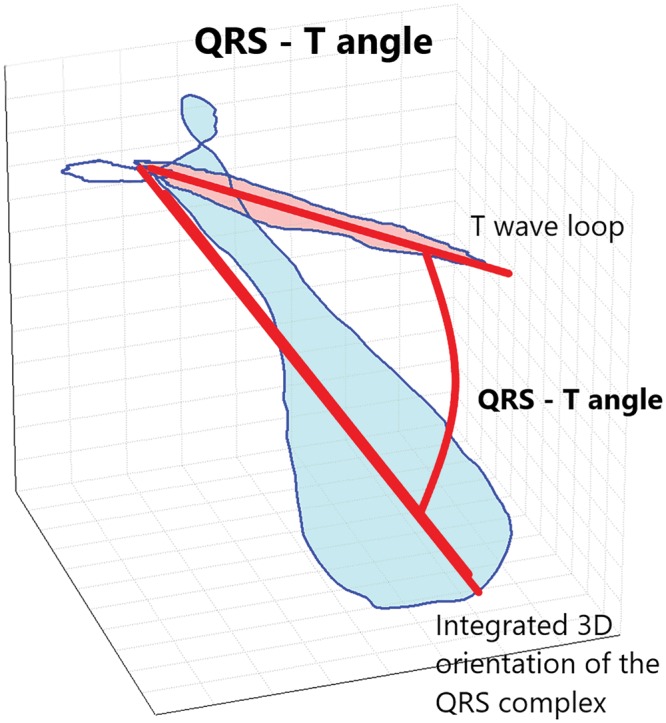
FIGURE 2.

A representation of QRS–T angle from vectorcardiograms.
