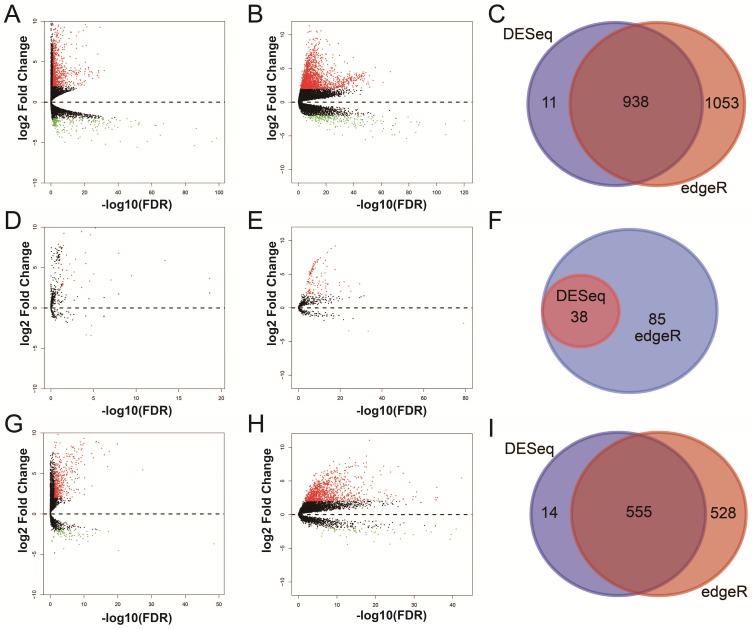
Figure 1.
Differentially expressed RNAs analysis of TCGA HCC dataset. Notes: (A) DEGs identified using the DESeq package; (B) DEGs identified using the edgeR package; (C) Overlapping DEGs. (D) DEMs identified using the DESeq package; (E) DEMs identified using the edgeR package; (F) Overlapping DEMs. (G) DELs identified using the DESeq package; (H) DELs identified using the edgeR package; (I) Overlapping DELs.

