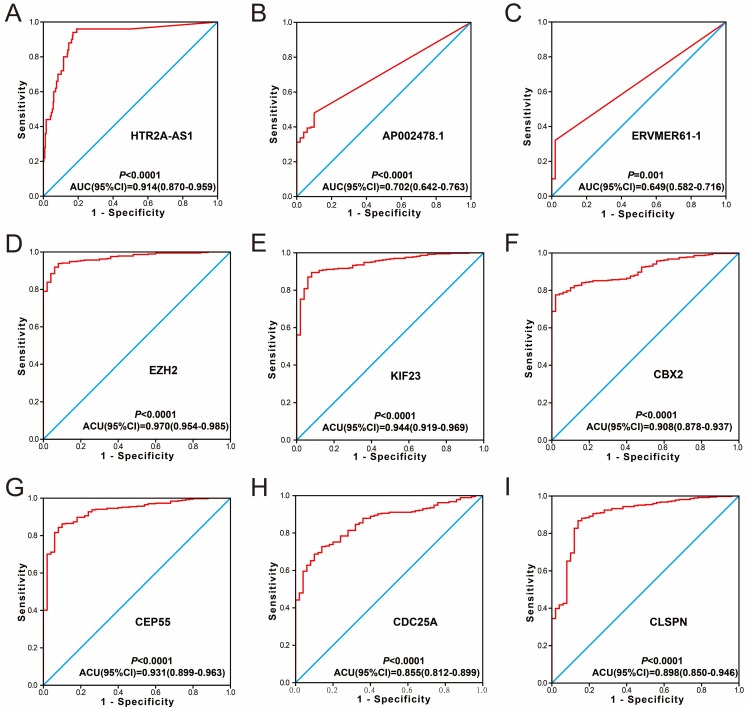
Figure 8.
Diagnosis ROC curve of 9 prognostic signature RNAs between HCC tumor and adjacent normal liver tissues. Notes: The order of ROC curves of 9 prognostic signature RNAs were as follow: (A) HTR2A-AS1, (B) AP002478.1, (C) ERVMER61-1, (D) EZH2, (E) KIF23, (F) CBX2, (G) CEP55, (H) CDC25A, (I) CLSPN.

