Fig 4.
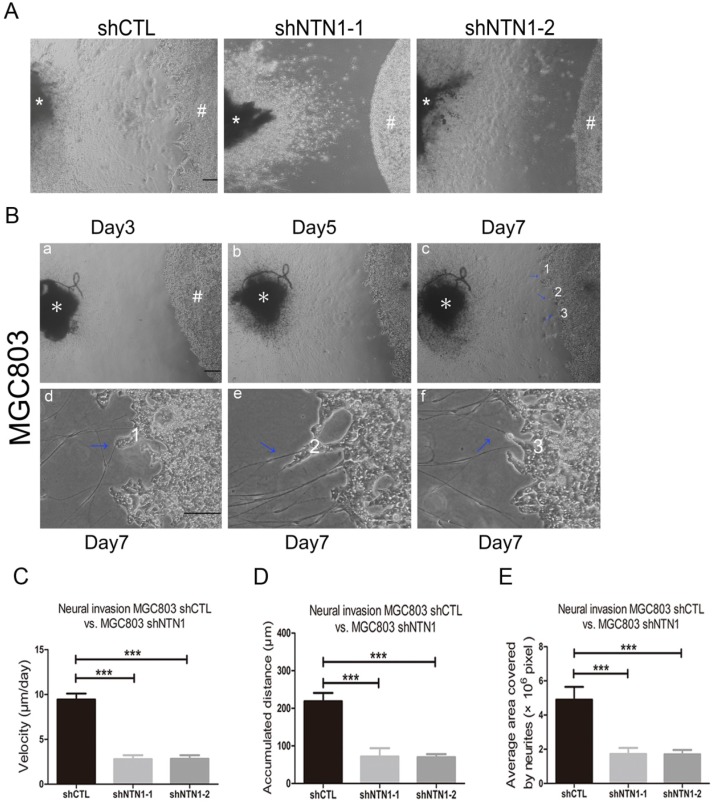
NTN1 knockdown suppressed GC cells neural invasion in DRG-tumor cell co-culture assay. A. Representative images of co-cultured with MGC803 control cells or MGC803 shNTN1 cells in the DRG-tumor cell co-culture assay. (#) indicates GC cells, (*) indicates DRG. Original magnification, 40×; Scale bar =100μm. B. Representative photomicrographs showing the entire process of the DRG-tumor cell interaction. (a-b) Three-dimensional co-culture of GC cells (#) and DRG (*) were assembled in Matrigel. (c) Outgrowth and extension (blue arrowheads) of neurites from the DRG toward the tumor cell colony around day 7. Original magnification, 40×; Scale bar=100μm. The lower panel showed that GC cells migrated along the neurites and neurites that projected into the cancer cell colonies. (d-e-f) Upon contact, tumor cells disengage and navigate along the contacted neurites (blue arrowheads) toward DRG. Numbers indicate sites of neurite-tumor cell contact initiation and refer to corresponding magnified areas in (c). Original magnification, 100×; Scale bar=100 μm. C. The travelling velocity of MGC803 control cells and MGC803 shNTN1 cells was calculated. D. The accumulated distance travelled by the MGC803 control cells and MGC803 shNTN1 cells was calculated. E. The average area covered by the neurites growing out from the DRG in different groups was quantified. *p < 0.05, **p < 0.01, ***p < 0.001.

