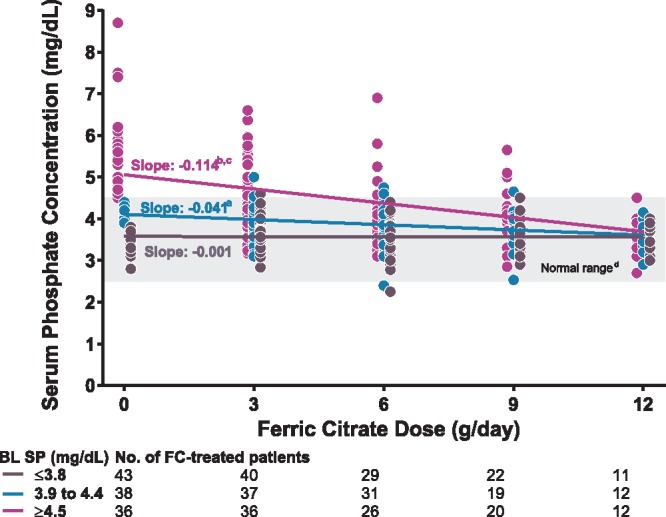
FIGURE 3.

Serum phosphate (SP) concentrations after dose increases of ferric citrate (FC) by baseline phosphate tertile (FC-treated patients only). For each tertile color coded as shown in the legend, circles indicate individual patient serum phosphate concentrations and the lines indicate the mixed-model regression line of best fit. aP = 0.013 versus lowest tertile slope. bP < 0.001 versus lowest tertile slope. cP < 0.001 versus middle tertile slope. dNormal laboratory reference range of SP. BL, baseline.
