
Figure 2.
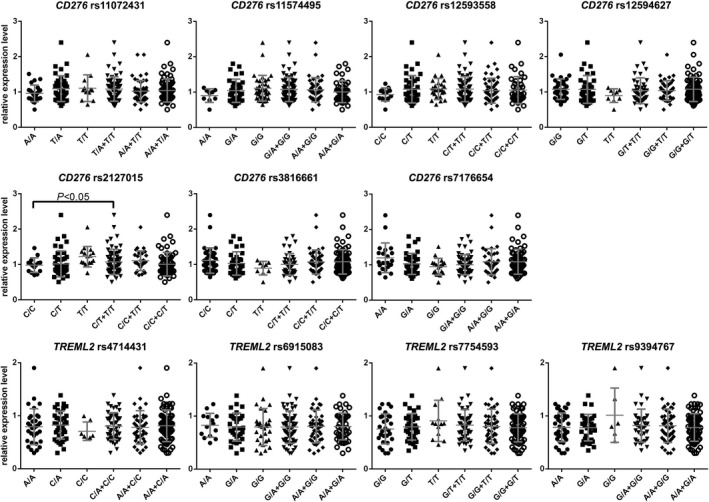
CD276 and TREML2 mRNA expression in PBMCs. Plots represented relative expression level of mRNA of each individual recipient. The result indicated that T allele carriers of rs2127015 expressed more CD276 mRNA than the others (p < 0.05). Bar represented mean ± standard deviation of the scatter plots