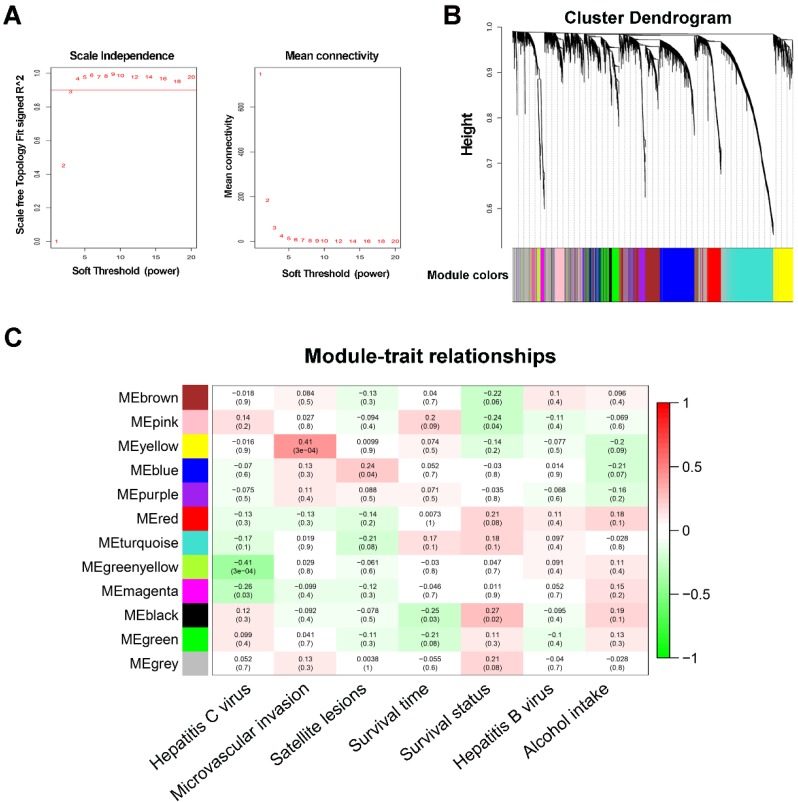
Figure 1.
WGCNA network and module detection. (A) Selection of the soft-thresholding powers. The left panel shows the scale-free fit index versus the soft-thresholding power. The right panel displays the mean connectivity versus the soft-thresholding power. Power 3 was chosen because the fit index curve flattened out upon reaching a high value (>0.9). (B) Cluster dendrogram and module assignment for modules from WGCNA. Genes cluster dendrogram drawn using a dissimilarity measure (1-TOM). The colored horizontal bar below the dendrogram represent the modules. A total of 6144 genes were assigned to one of 12 modules including the gray module. (C) Each column corresponds to a clinical feature and each row to an eigengene module. Each cell contains the corresponding correlation on the first line and the p-value on the second line. The table is color-coded by correlation according to the color legend. The gray module included all the genes that could not be clustered.

