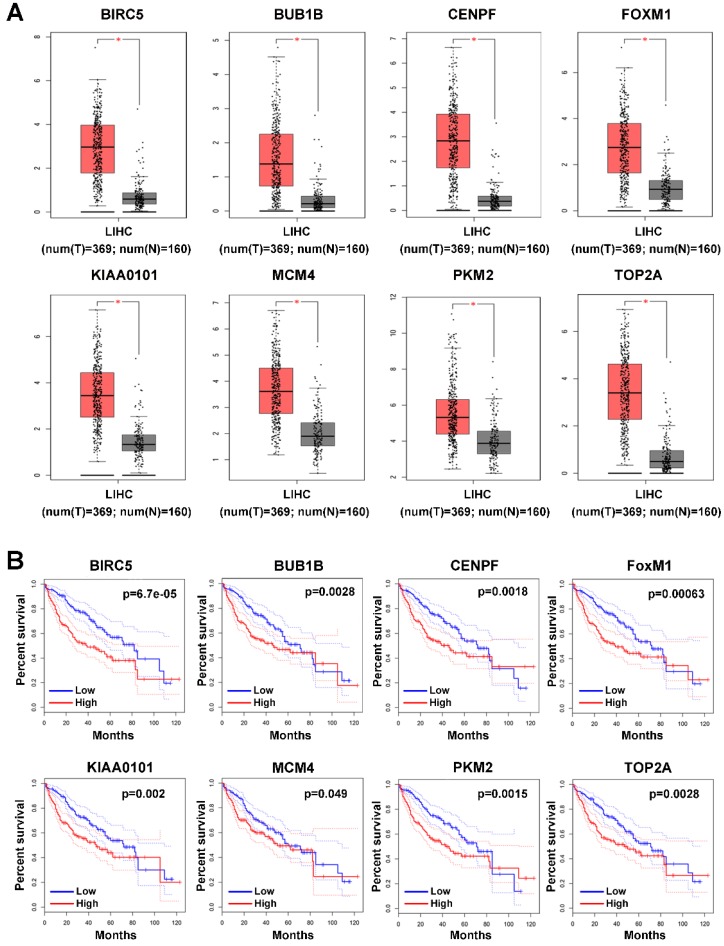
Figure 3.
Expression profile and prognostic value of hub genes in HCC tumor tissues. (A) Expression profile of hub genes in HCC tumor tissues (T) and nontumor tissues (N) in GEPIA based on the TCGA and GTEx databases. Log(FC)≥1, and *P<0.05 were set as the criteria. (B) The prognostic value of the hub genes in HCC patients based on the TCGA database analyzed by GEPIA. The median expression level was set as the cut-off value.

