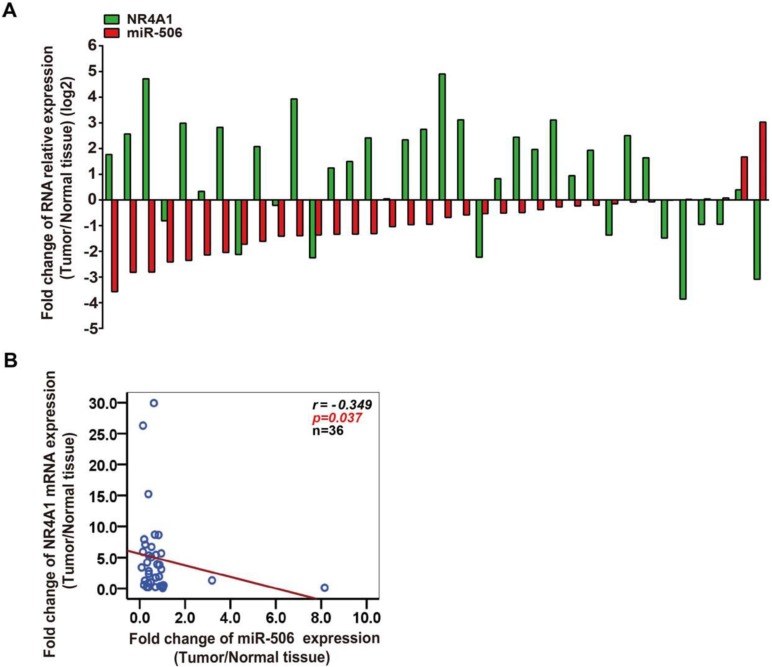
Figure 3.
NR4A1 expression correlates with miR-506 level in colorectal cancer tissues. A. The graph revealed a one-to-one relationship between fold change of NR4A1 mRNA and miR-506 level. The ratio of NR4A1/miR-506 expression level in colorectal cancer tissue (T) to corresponding tumor-adjacent normal tissue (N) was measured to analyze the fold change for each patient. Green: NR4A1, red: miR-506 (n=36). B. Spearman correlation analysis demonstrated a negative relationship between NR4A1 expression and miR-506 level (n=36).

