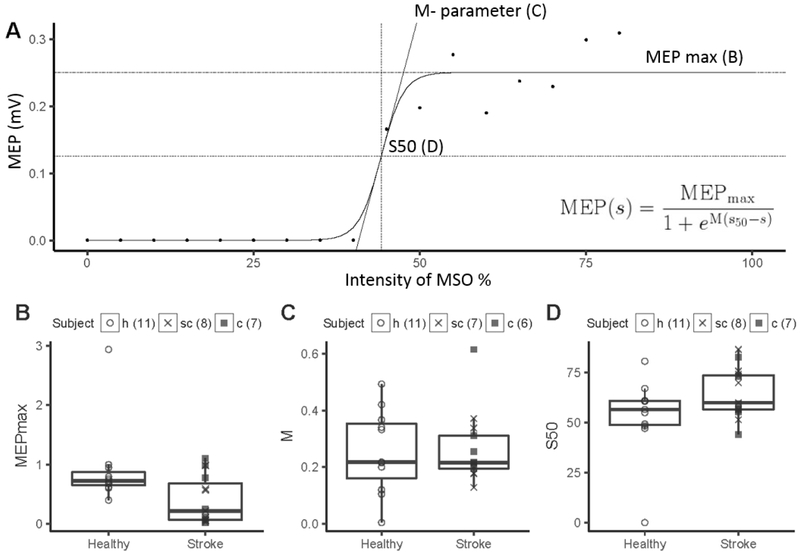
Figure 2. Ipsilesional M1 excitability measured with TMS.
A) The stimulus response curve (SRC) evoked by transcranial magnetic stimulation of increasing intensities (35% to 80% of maximum stimulator output) were plotted for a single stroke patient. B, C, D). A three-parameter Boltzmann function was fitted to all SRCs that reached a plateau using the Levenberg-Marquard least-squares algorithm (insert) to extract three curve parameters: MEPmax (plateau of SRC), S50 (TMS intensity needed to elicit an MEP of an amplitude corresponding to the inflection point) and M (slope) parameter. The data are plotted for 15 stroke patients with cortical or subcortical location of a stroke affecting their M1 output system and 11 right handed age- matched healthy subjects. The number of subjects for each parameter is indicated in the figure. MEPmax was statistically significant lower in stroke subjects than in healthy subjects (p=0.02). There was no statistically significant difference in M-parameter and S50 between stroke and healthy subjects. This approach povides a more detailed analysis of M1 excitability. When measured at a constant level of motor activity (here, at rest), the three SRC curve parameters (S50, M-parameter, and MEPmax) completely characterize the input-output relationship of the M1 corticospinal output(Devanne et al., 1997). Therefore, a change in one or more parameters indicates a change in the input-output relationship in iM1 and its corticospinal output. The abnormally low MEPmax found here suggests that CST output from iM1 was reduced after stroke (Buetefisch et al., 2018).

